Getting Started
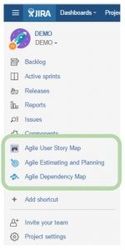
Each of you Scrum or Kanban boards has an associated Agile Dependency Map Access a Dependency Map from any agile board by using the left hand navigation bar and selecting ‘Agile Dependency Map’.
Each of you Scrum or Kanban boards has an associated Agile Dependency Map Access a Dependency Map from any agile board by using the left hand navigation bar and selecting ‘Agile Dependency Map’.
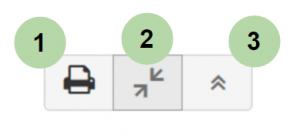
The workspace is divided into three parts. At the upper right you will find the workspace preferences. At the left hand you have filter options to fine-tune the map. The large area between is the visualized Dependency Map.
After entering Agile Dependency Map workspace, there are a number of options that you can see here. We suggest you to go through these options one by one before proceeding with the map. These options provide the most basic knowledge of essential map elements and how to use them to view your map.
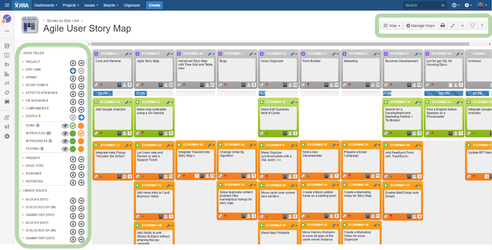
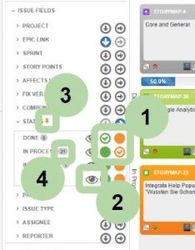
Cards can be hidden or displayed in different colors depending on the filter preferences. The following example shows a set of filter options (you might have more options depending on your data and JIRA project).
These filters show the stories; the story board is the entire map based upon the criteria that you specify:
You can also change the appearance of your Dependency Map and the way cards appear on it by simply changing the Filter types.
YOUR SELECTED FILTER OPTIONS ARE SAVED IN YOUR PERSONAL USER PREFERENCES AND AVAILABLE AGAIN NEXT TIME YOU VISIT AGILE DEPENDENCY MAP ADD ON.
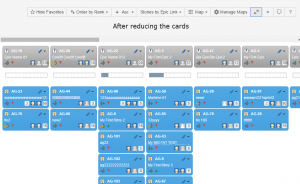
Fitting the screen to your map can be achieved by the browser’s built-in zoom functionality. Therefore press “ctrl” and “+” or “-” simultaneously. However some browsers do not render the zoomed map properly – in this case just refresh the page and everything fits the size that you have selected.
A Story is a card and an Epic is the grouping unit for multiple stories. (If an advanced JQL is applied for the map then other issue types can also be visualized as a card)
A card is an entire story that is shown with its summary and its description as tool tip.
There are two types of Cards in the JIRA Dependency Map plugin:
Stories Epics, or the column’s headline
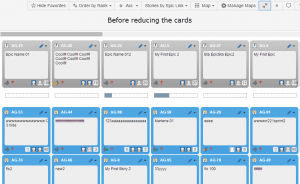
An Epic is a grouping unit, which is always gray and contains its related Stories. The Stories can be grouped and ordered in different ways – their color depends on the filter settings. Each card displays a compact set of information:
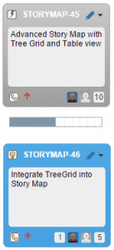
At the left top of the card the Issue Type is displayed, followed by the JIRA ID which is linked to the standard JIRA-Issue view. The pencil icon opens a context menu with multiple options. The large area in the middle shows the summary field, and the description when moving the mouse over.
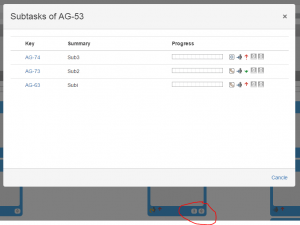
The lower side shows JIRA status, priority, affected version, count of sub-tasks, assignee, reporter and the JIRA agile estimation value. The progress bar shows the headway made by the epic. This is calculated using the estimation values: The sum of story points of stories that have a resolution divided by the sum of all story points.
Cards can be easily edited. All you need to do is click inside them and enter the information to update.
The progress bar shows how many projects have been completed successfully.
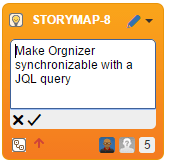
Simply click inside the card and edit the issue’s summary. Press tab or click the arrow to save your changes or click the X to cancel. The same functionality can be used in cards or in TreeGrid view. For advanced editing, like changing the description or adding a comment, use the ‘Edit’ button from the context menu.

MOVE COLUMN is only available for Epics. It enables you to move the entire column ether to the left or to the right.